~ Design lab ~

~ Design lab ~

A space for structured experimentation 🧪

Here I document lightweight design studies inspired by my ongoing research in interaction design, AI tools, prompt engineering, and user psychology. These are fast explorations created to test ideas, interaction patterns, and emerging product workflows without the pressure of building a full case study.

Kanban Payments: exploring a visual way to manage multiple bills

Kanban Payments: exploring a visual way to manage multiple bills

While working on payment workflows for SMBs and larger companies, I kept noticing how complex bill management can become.

Finance teams often deal with dozens (sometimes hundreds) of invoices simultaneously, each in a different state: pending, scheduled, under validation, processing, failed, or completed.

Most systems represent this through dense tables or fragmented filters.

I wondered if a simpler interaction model could make this easier to understand.

Trello demonstrates a powerful design principle: start simple, and reveal complexity only when the user needs it.

A board can begin with just three columns — To Do, Doing, Done — and still support extremely complex workflows as users add detail.

This experiment explores what would happen if that interaction model were applied to payment management.

The concept was to represent bills as movable cards in a kanban-style board:

→ Pending (To Do): bills that require action, such as new invoices or failed payment attempts

→ Processing (Doing): payments currently in progress, scheduled transactions, validations, or bank processing

→ Completed (Done): bills already paid, cancelled, or expired


Interaction
Instead of navigating multiple forms, users interact with payments directly on the board.

Dragging a bill to Processing can trigger a modal to schedule or confirm the payment.

Moving a card to Completed prompts actions such as marking the bill as paid, ignoring it, or cancelling the transaction.

As the concept evolved, the board also explored batch interactions, allowing users to select multiple bills and move them together for bulk scheduling and payment operations.

Montly insights
To complement the kanban workflow, I also explored a monthly insights area designed to give entrepreneurs a quick and actionable overview of their outgoing payments.

Instead of focusing only on individual bills, this section helps users step back and understand the bigger picture: payment status distribution, monthly trends, and category-level spending. For business owners, this kind of summary can make the experience more strategic, turning bill management into a clearer view of cash flow, priorities, and potential risks.


Tools
This experiment was prototyped using AI-assisted tools such as v0 and Lovable, using prompt engineering to quickly explore interface structures and interaction patterns.

The goal was not production feasibility, but rapid interaction exploration.

This initial exploration was designed for desktop screens. I recommend opening it on a computer for the best viewing experience.

Open Interactive Prototype

AI-Driven Investment Dashboard: Exploring intelligent portfolio insights and personalized investment recommendations

AI-Driven Investment Dashboard: Exploring intelligent portfolio insights and personalized investment recommendations

This exploration investigates how modern investment dashboards can evolve from passive data displays into intelligent decision-support systems.

Instead of simply presenting portfolio metrics, the goal was to design an interface that helps investors understand their position, identify opportunities, and take action with confidence.

The project focuses on how AI-powered insights, strategic information architecture, and personalized recommendations can transform a traditional portfolio dashboard into a financial co-pilot.

Smart alerts: AI-powered insights from portfolio analysis


One of the core explorations was how AI could generate meaningful alerts by crossing different layers of information: market signals, portfolio composition, risk exposure, and asset performance.

Instead of generic notifications, the system surfaces contextual insights such as concentration risks, diversification opportunities, and market movements that may impact the user’s portfolio.

The goal is to move beyond static dashboards and create a system capable of transforming raw financial data into intelligent prompts that guide decision-making.

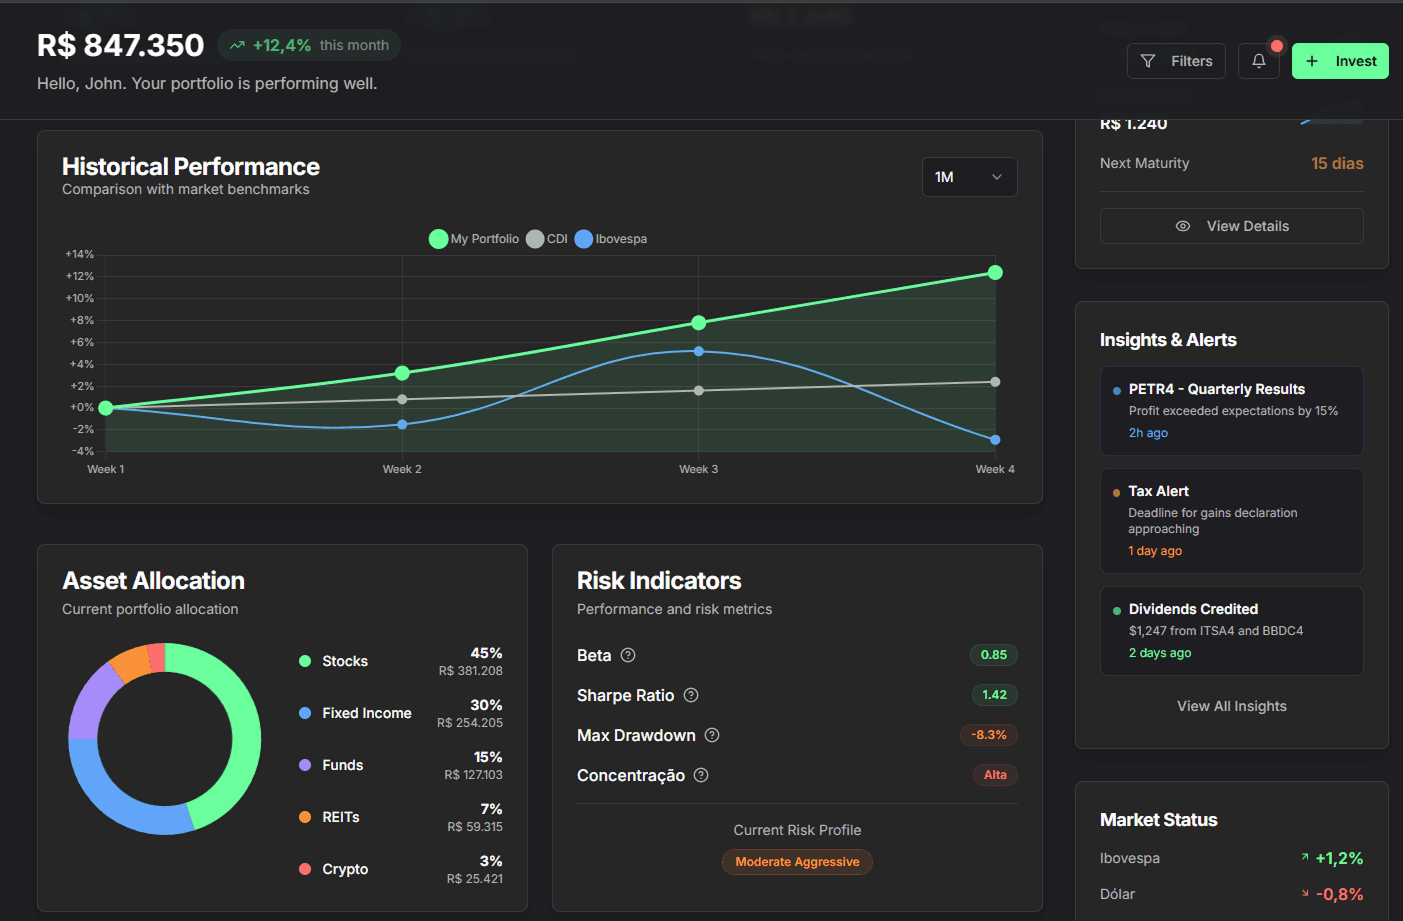
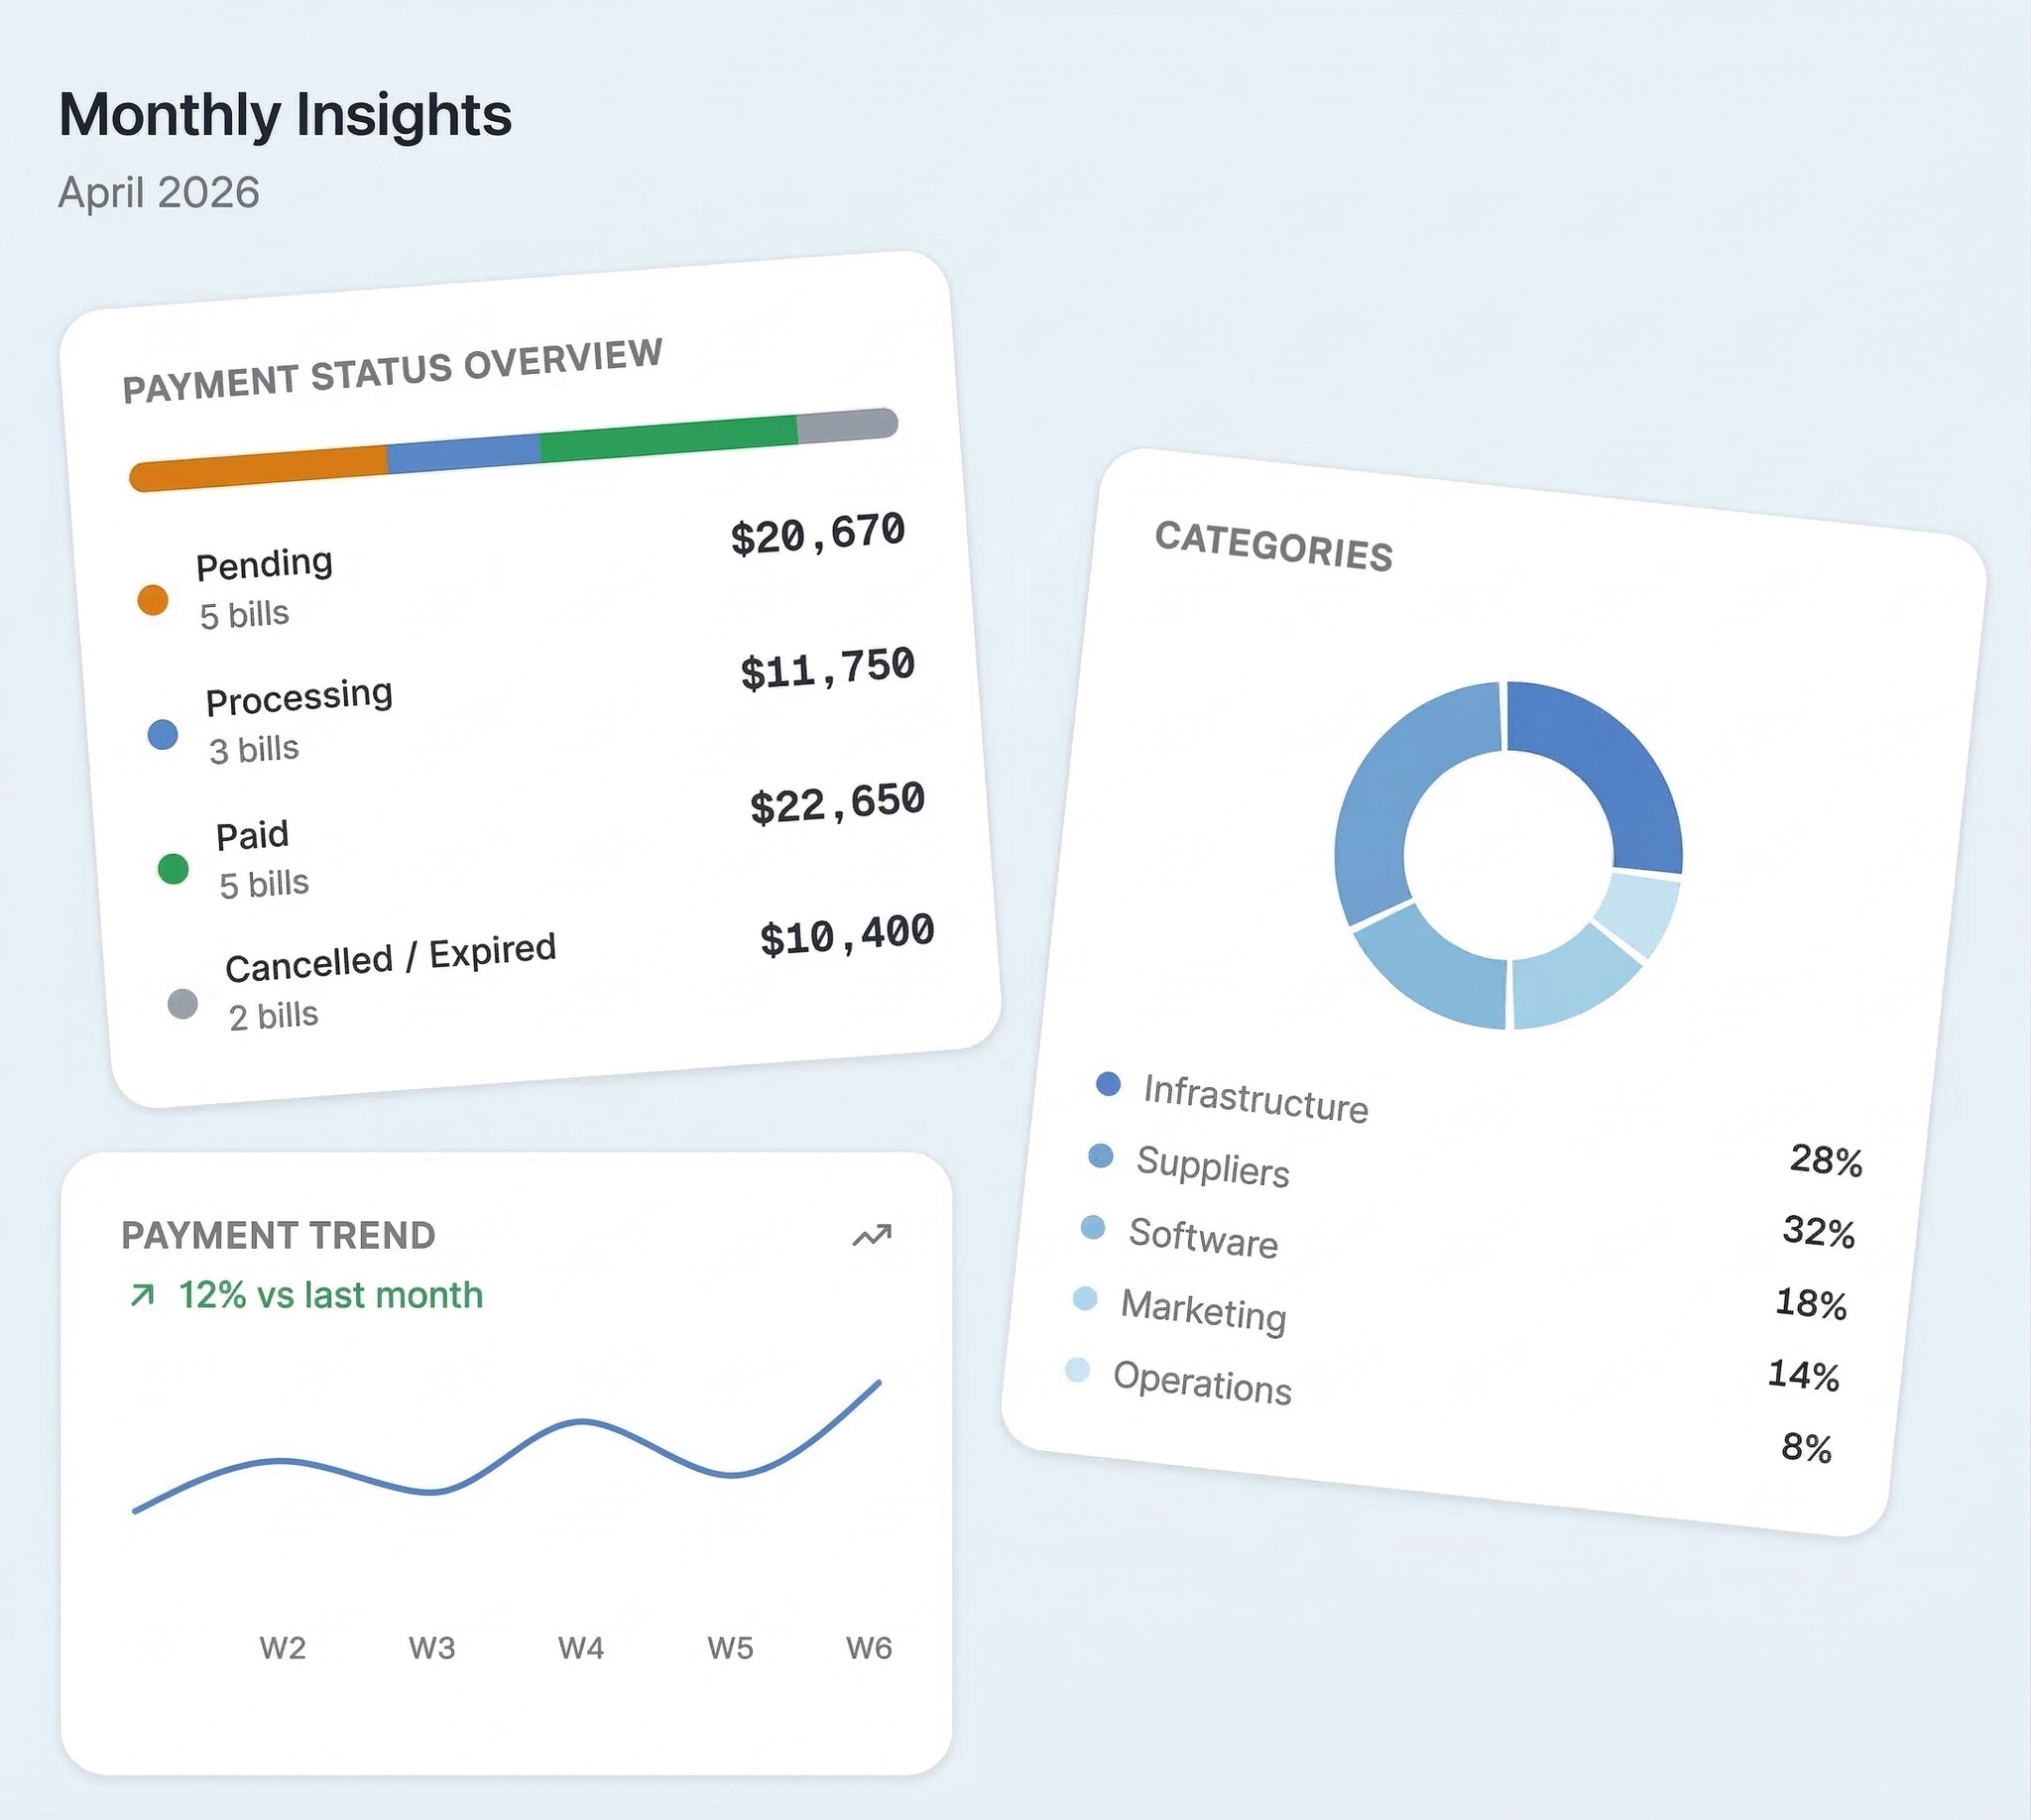
Information hierarchy: Designing dashboards for both novice and expert investors


Another focus of the exploration was information hierarchy.

Investment dashboards often suffer from excessive data density, forcing users to interpret complex metrics before understanding the bigger picture.


This design prioritizes the most critical signals first, portfolio value, performance, and key risk indicators, while allowing deeper analysis through progressive disclosure.

The interface was designed to adapt to different investor profiles: beginners can rely on simplified summaries and guidance, while experienced users can explore deeper layers of data and analysis.

Personalized investment recommendations: when product strategy meets portfolio intelligence


The exploration also investigates how personalized investment recommendations can become a powerful product strategy.

By combining portfolio analysis, investor profile, asset allocation gaps, and expert recommendations, the system can surface highly relevant investment opportunities.

This approach transforms recommendations from generic product promotion into contextual financial guidance, creating a more valuable experience for investors while also opening strategic opportunities for financial platforms.


Tools:
This concept was prototyped using AI-assisted tools and research-driven design.

Deep desk research was conducted using Gemini’s advanced research capabilities to analyze fintech UX patterns, behavioral finance principles, and portfolio analytics dashboards.

The interface prototype was then explored using modern prototyping tools (Lovable and V0) to translate these insights into a tangible dashboard concept.

The v0 version of this exploration is not mobile-friendly. I created a more responsive version in Lovable, although both prototypes are best experienced on desktop.

Open lovable Prototype

Let's work together

I'm currently open to remote design opportunities, whether freelance, contract, or full-time. I help teams build high-impact digital products through a mix of strategy, design, and user research, with a strong focus on usability, clarity, and business alignment.


Ready to explore a project together?

Create a free website with Framer, the website builder loved by startups, designers and agencies.